The IRS recently announced the 2024 tax brackets. Given many people are interested in the changes, we wanted to include the latest tax bracket updates as quickly as possible.
If you're looking for past year's tax brackets, check out the tables below.
Over the last few years, there have been a number of changes to the tax law. These include new federal tax brackets, standard deduction changes, and elimination of the personal exemption. When you add in inflation on top of it, these tables and tax brackets are changing dramatically from year to year.
To better compare the tax brackets, we've included the historical ones below.
Check this out if you're looking for the specific Capital Gains Tax Brackets and Rates.
2024 Federal Tax Brackets
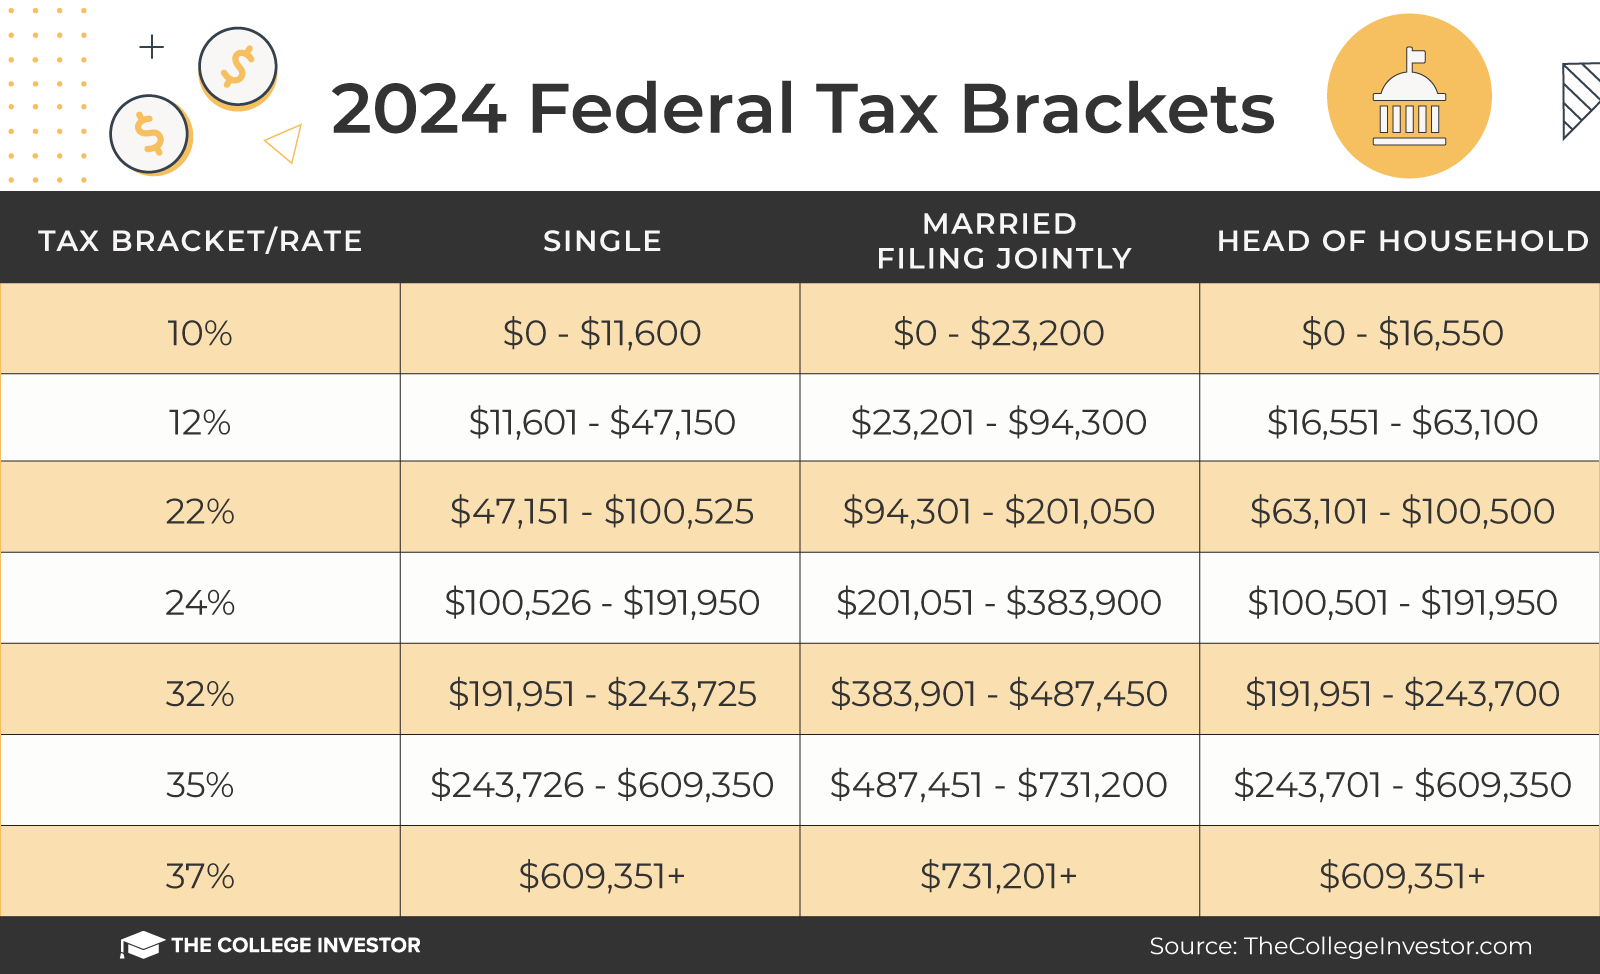
Here are the 2024 Federal tax brackets. Remember, these aren't the amounts you file for your tax return, but rather the amount of tax you're going to pay starting January 1, 2024 to December 31, 2024. These bracket ranges increased significantly for 2024 due to rising inflation.
The table below shows the tax bracket/rate for each income level:

2024 Federal Tax Brackets | |||
|---|---|---|---|
Tax Bracket/Rate | Single | Married Filing Jointly | Head of Household |
10% | $0 - $11,600 | $0 - $23,200 | $0 - $16,550 |
12% | $11,601 - $47,150 | $23,201 - $94,300 | $16,551 - $63,100 |
22% | $47,151 - $100,525 | $94,301 - $201,050 | $63,101 - $100,500 |
24% | $100,526 - $191,950 | $201,051 - $383,900 | $100,501 - $191,950 |
32% | $191,951 - $243,725 | $383,901 - $487,450 | $191,951 - $243,700 |
35% | $243,726 - $609,350 | $487,451 - $731,200 | $243,701 - $609,350 |
37% | $609,351+ | $731,201+ | $609,351+ |
2024 Standard Deduction
The standard deduction has also increased a lot for 2024, due to inflation, which you can see in the table below.
Standard Deduction Amount | |
|---|---|
Filing Status | 2024 |
Single | $14,600 |
Married Filing Jointly | $29,200 |
Head of Household | $21,900 |
2023 Federal Tax Brackets
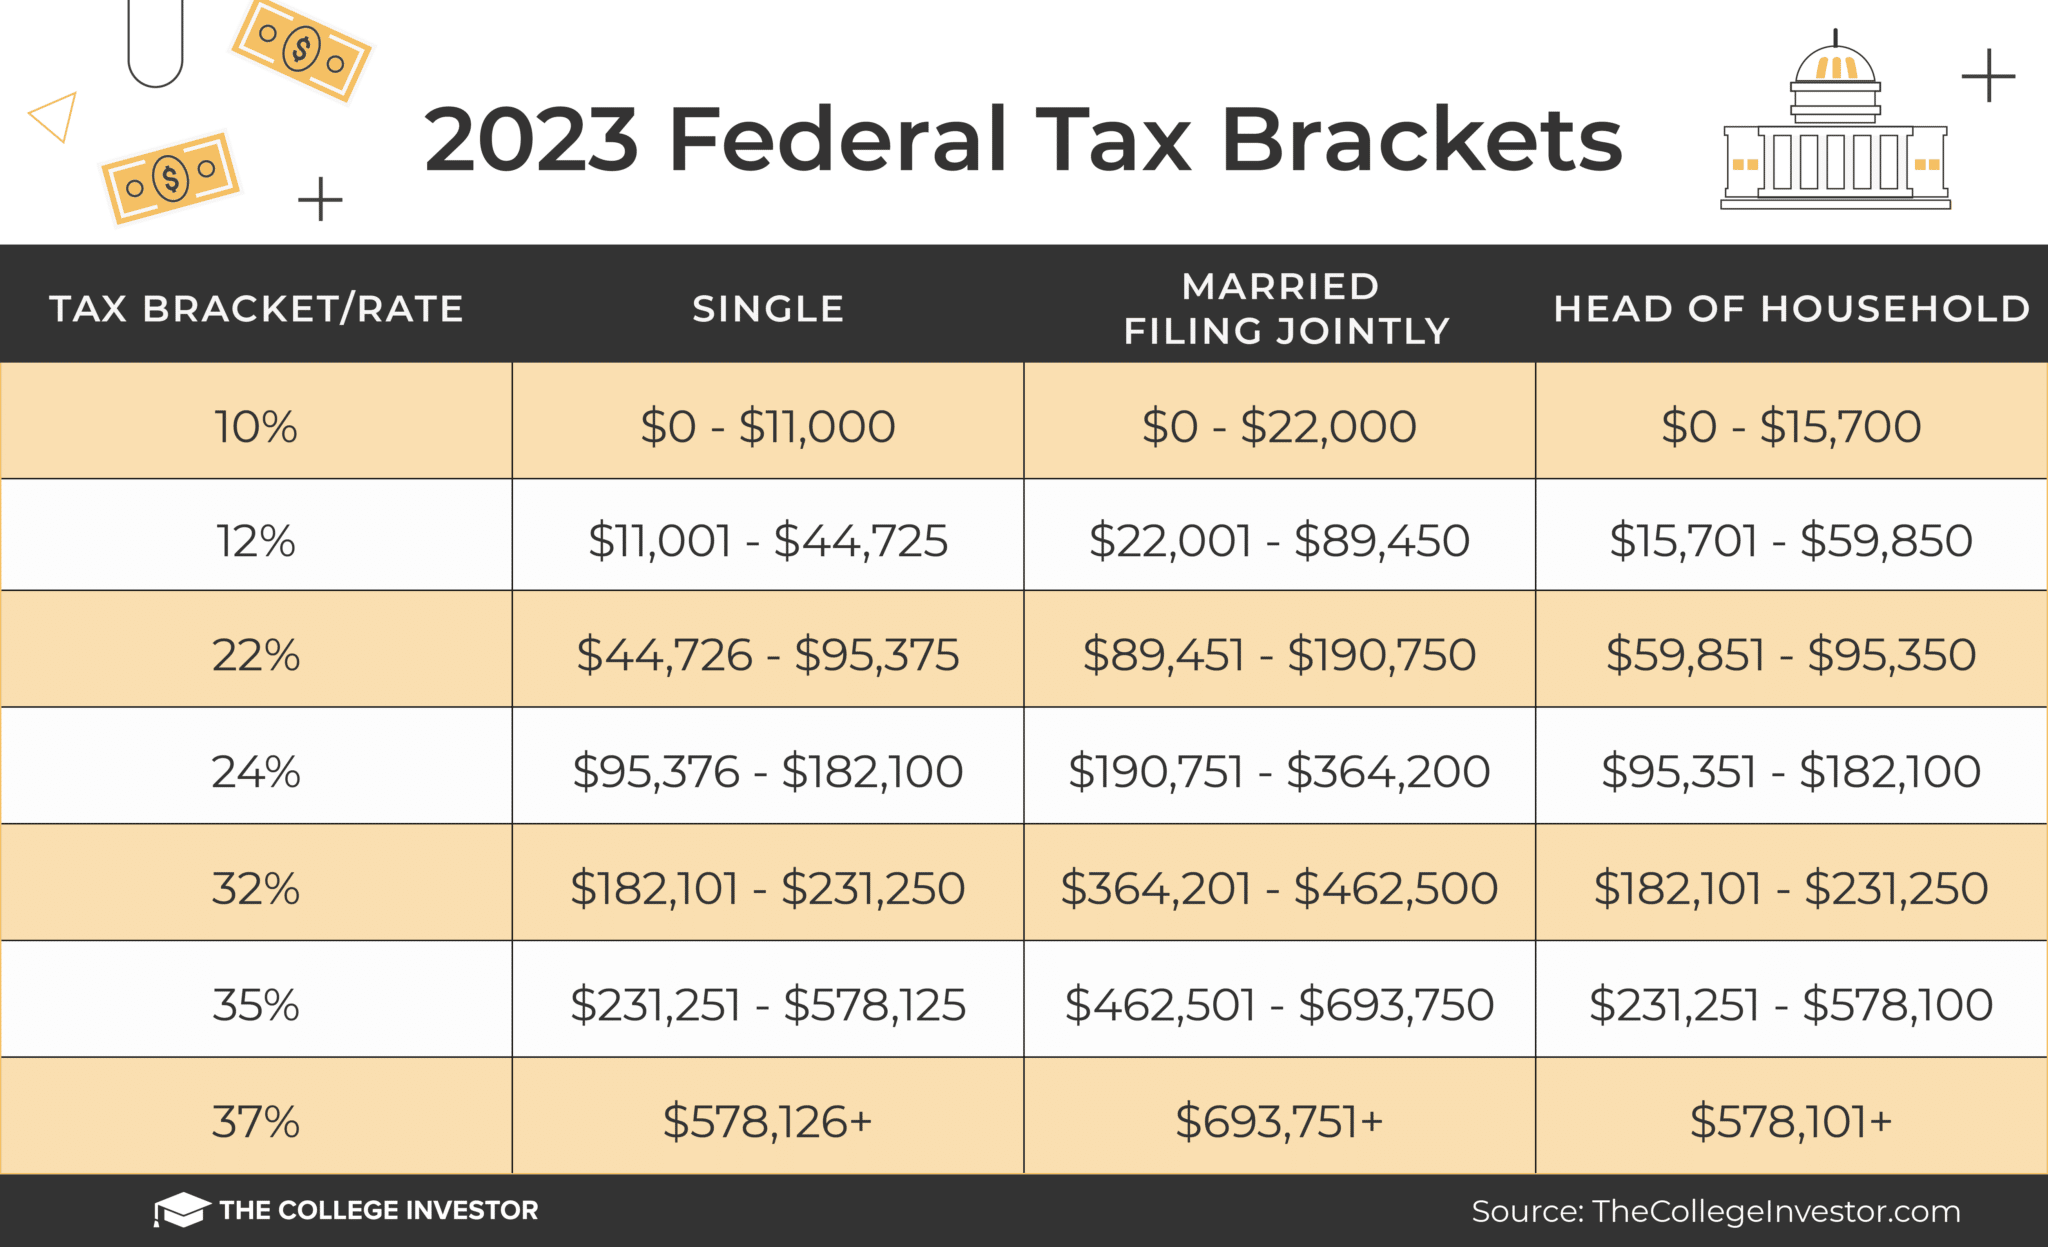
Here are the 2023 Federal tax brackets. Remember, these aren't the amounts you file for your tax return, but rather the amount of tax you're going to pay starting January 1, 2023 to December 31, 2023. These brackets significantly increased for 2023 due to rising inflation.
The table below shows the tax bracket/rate for each income level:

2023 Federal Tax Brackets | |||
|---|---|---|---|
Tax Bracket/Rate | Single | Married Filing Jointly | Head of Household |
10% | $0 - $11,000 | $0 - $22,000 | $0 - $15,700 |
12% | $11,000 - $44,725 | $22,001 - $89,450 | $15,701 - $59,850 |
22% | $44,726 - $95,375 | $89,451 - $190,750 | $59,851 - $95,350 |
24% | $95,376 - $182,100 | $190,751 - $364,200 | $95,351 - $182,100 |
32% | $182,101 - $231,250 | $364,201 - $462,500 | $182,101 - $231,250 |
35% | $231,251 - $578,125 | $462,501 - $693,750 | $231,251 - $578,100 |
37% | $578,126+ | $693,751+ | $578,101+ |
2023 Standard Deduction
The standard deduction has also increased a lot for 2023, due to inflation, which you can see in the table below.
Standard Deduction Amount | |
|---|---|
Filing Status | 2023 |
Single | $13,850 |
Married Filing Jointly | $27,700 |
Head of Household | $20,800 |
Prior Year Tax Brackets
Looking for some history? Here are the past years tax brackets and standard deduction levels.
For 2020 and 2021, the Federal tax brackets are very similar to what you saw in 2019. There are some slight changes, but nothing major like we saw from 2017 to 2018 with the Trump Tax Cuts and Jobs Act. However, 2022 is when things started expanding a bit.
The bottom line is that all the tax bracket upper limits went up a little bit.
The tables below shows the tax bracket/rate for each income level:
Here are the 2022 Federal tax brackets. Remember, these are the amounts you will pay when you file your taxes in January to April 2023 (for the year January 1, 2022 through December 31, 2022).
The table below shows the tax bracket/rate for each income level:
Tax Bracket/Rate | Single | Married Filing Jointly | Head of Household |
|---|---|---|---|
10% | $0 - $10,275 | $0 - $20,550 | $0 - $14,650 |
12% | $10,276 - $41,775 | $20,551 - $83,550 | $14,651 - $55,900 |
22% | $41,776 - $89,075 | $83,551 - $178,150 | $55,901 - $89,050 |
24% | $89,076 - $170,050 | $178,151 - $340,100 | $89,051 - $170,050 |
32% | $170,051 - $215,950 | $340,101 - $431,900 | $170,051 - $215,950 |
35% | $215,951 - $539,900 | $431,901 - $647,850 | $215,951 - $539,900 |
37% | $539,901+ | $647,851+ | $539,901+ |
Here are the 2021 Federal tax brackets.
The table below shows the tax bracket/rate for each income level:
Tax Bracket/Rate | Single | Married Filing Jointly | Head of Household |
|---|---|---|---|
10% | $0 - $9,950 | $0 - $19,900 | $0 - $14,200 |
12% | $9,951 - $40,525 | $19,901 - $81,050 | $14,201 - $54,200 |
22% | $40,526 - $86,375 | $81,051 - $172,750 | $54,201 - $86,350 |
24% | $86,376 - $164,925 | $172,751 - $329,850 | $86,351 - $164,900 |
32% | $164,926 - $209,425 | $329,851 - $418,850 | $164,901 - $209,400 |
35% | $209,426 - $523,600 | $418,851 - $628,300 | $209,401 - $523,600 |
37% | $523,601+ | $628,301+ | $523,601+ |
The standard deduction also slightly increased for 2021, which you can see in the table below.
Filing Status | 2021 |
|---|---|
Single | $12,550 |
Married Filing Jointly | $25,100 |
Head of Household | $18,800 |
Here are the 2020 Federal tax brackets.
Tax Bracket/Rate | Single | Married Filing Jointly | Head of Household |
|---|---|---|---|
10% | $0 - $9,875 | $0 - $19,750 | $0 - $14,100 |
12% | $9,876 - $40,125 | $19,751 - $80,250 | $14,101 - $53,700 |
22% | $40,126 - $85,525 | $80,251 - $171,050 | $53,701 - $85,500 |
24% | $85,526 - $163,300 | $171,051 - $326,600 | $85,501 - $163,300 |
32% | $163,301 - $207,350 | $326,601 - $414,700 | $163,301 - $207,350 |
35% | $207,351 - $518,400 | $414,701 - $622,050 | $207,351 - $518,400 |
37% | $518,401+ | $622,051+ | $518,401+ |
Here are the 2019 Federal tax brackets.
Tax Bracket/Rate | Single | Married Filing Jointly | Head of Household |
|---|---|---|---|
10% | $0 - $9,700 | $0 - $19,400 | $0 - $13,850 |
12% | $9,701 - $39,475 | $19,401 - $78,950 | $13,851 - $52,850 |
22% | $39,476 - $84,200 | $78,951 - $168,400 | $52,851 - $84,200 |
24% | $84,201 - $160,725 | $168,401 - $321,450 | $84,201 - $160,700 |
32% | $160,726 - $204,100 | $321,451 - $408,200 | $160,701 - $204,100 |
35% | $204,101 - $510,300 | $408,201 - $612,350 | $204,101 - $510,300 |
37% | $510,301+ | $612,351+ | $510,301+ |
Here are the 2018 Federal tax brackets. This was a year of big change due to the Tax Cuts and Jobs Act.
Tax Bracket/Rate | Single | Married Filing Jointly | Head of Household |
|---|---|---|---|
10% | $0 - $9,525 | $0 - $19,050 | $0 - $13,600 |
12% | $9,526 - $38,700 | $19,051 - $77,400 | $13,601 - $51,800 |
22% | $38,701 - $82,500 | $77,401 - $165,000 | $51,801 - $82,500 |
24% | $82,501 - $157,500 | $165,001 - $315,000 | $82,501 - $157,500 |
32% | $157,501 - $200,000 | $315,001 - $400,000 | $157,501 - $200,000 |
35% | $200,001 - $500,000 | $400,001 - $600,000 | $200,001 - $500,000 |
37% | $500,000+ | $600,001+ | $500,000+ |
Calculating Your Withholdings
If you’d like to calculate your withholdings, you can use the IRS withholding calculator found at https://apps.irs.gov/app/withholdingcalculator/.
And note, remember on top of your Federal taxes, you also have to pay FICA Taxes. These are the payroll taxes that go to Social Security and Medicare. Plus, you may have to pay state taxes depending on your state.

Robert Farrington is America’s Millennial Money Expert® and America’s Student Loan Debt Expert™, and the founder of The College Investor, a personal finance site dedicated to helping millennials escape student loan debt to start investing and building wealth for the future. You can learn more about him on the About Page or on his personal site RobertFarrington.com.
He regularly writes about investing, student loan debt, and general personal finance topics geared toward anyone wanting to earn more, get out of debt, and start building wealth for the future.
He has been quoted in major publications, including the New York Times, Wall Street Journal, Washington Post, ABC, NBC, Today, and more. He is also a regular contributor to Forbes.
Editor: Colin Graves Reviewed by: Ohan Kayikchyan Ph.D., CFP®